|
GOULD-PRESIDENTIAL ADDRESS
|
323
|

FIGURE 3--Size at first appearance for species of planktonic
foraminifera in their three radiations. Triangles indicate that two
or more species occupy the same point
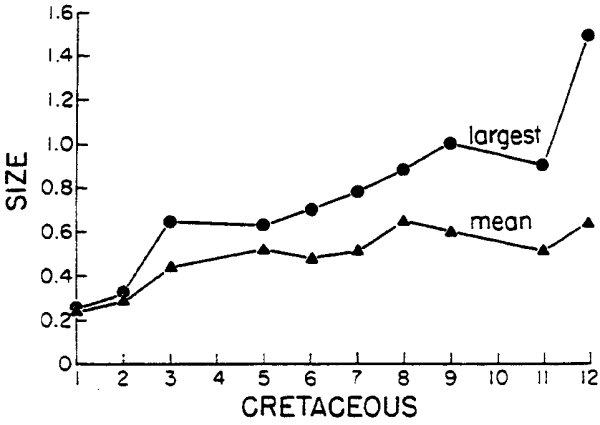
FIGURE 4--Inappropriate use of mean or extreme values
to specify a trend of increasing size where none exists under an alternate,
and often more appropriate, interpretation. The Cretaceous is divided
into five-million-year intervals.
ceous, and Neogene rises continue throughout). But closer inspection
suggests a different interpretation based on increasing variance about
an asymmetrical starting point. Each of the three phases begins with species
near a minimum in size. (In this case, the minimum is more strictly, if
artificially, defined than usual. The founders of all three phases lie
near the smallest size for retention on the sieving mesh traditionally
used to recover foraminifers from sediment) This domain of small size
remains continually occupied throughout the clade's history, while expansion
of variance proceeds upward in the only available direction as more and
more species are added The appearance of Cope's rule is an automatic consequence
of increasing variance in successful clades (assessed by growth in numbers
of extant species).
Figure 4 illustrates the dilemma of myopic and inappropriate anagenetic
interpretations. A plot of the largest species arising in each 5 m.y.
unit vs. time shows a virtually unreversed rise-but this "trend"
primarily records the increasing variance and right skewness of the distribution,
as species number grows. The plot of mean value vs. time shows that central
tendencies may reinforce the same myopia--for means increase, if less
strikingly, because the right tail expands while the left tail remains
constrained.
Figure 5 presents a more adequate interpretation consistent with the
insights of Stanley and Jablonski. Size of the largest species increases
m all three segments, but size of the smallest species either remains
constant or decreases slightly. Thus, an increase in the envelope of variation--the
occupied size range--is the primary phenomenon that generates anagenetic:
misconceptions.
The chart of correlation coefficients vs. time (3 m.y. segments for
the Cenozoic, 5. m.y. for the Cretaceous) clarifies the genesis of this
pattern (Table 1). Correlations are positive for extreme values and measures
of central tendency, but strength of correlation decreases, exactly as
expected when the full system experiences increasing variance and right
skew--highest values for extreme size, lower for mean values, still
lower for medians. Yet correlation coefficients for smallest species vs.
time are in-significant in all cases, and negative in two of three. High
correlations with direct measures of variation--total size range of
species, and coefficient of variation--are positive and significant
(except for the Paleogene, with its downturn following maxi-
|